Schedule call
Cluster.dev is a tool designed to template infrastructure patterns (stacks). It operates with a number of prepared stack templates to launch and provision Kubernetes clusters in the preferred cloud.
In this article we will use and modify the basic AWS-K3s Cluster.dev template to deploy the Prometheus monitoring stack to a cluster. As a result we will have a K3s cluster in AWS with a set of required controllers (Ingress, cert-manager, Argo CD) and installed kube-prometheus stack. The code samples are available in the GitHub repository.
Requirements
OS
We should have some client host with Ubuntu 20.04 to use this manual without any customization.
Docker
We should install Docker to the client host.
AWS account
Log in into existing AWS account or register a new one. Select an AWS region in order to deploy the cluster in that region. Add a programmatic access key for a new or existing user. Note that it should be an IAM user with granted administrative permissions. Open bash terminal on the client host. Get an example environment file env to set our AWS credentials:
curl https://raw.githubusercontent.com/shalb/monitoring-examples/main/cdev/monitoring-cluster-blog/env > env
Add the programmatic access key to the environment file env.

Create and deploy the project
Get example code
mkdir -p cdev && mv env cdev/ && cd cdev && chmod 777 ./
alias cdev='docker run -it -v $(pwd):/workspace/cluster-dev --env-file=env clusterdev/cluster.dev:v0.6.3'
cdev project create https://github.com/shalb/cdev-aws-k3s?ref=v0.3.0
curl https://raw.githubusercontent.com/shalb/monitoring-examples/main/cdev/monitoring-cluster-blog/stack.yaml > stack.yaml
curl https://raw.githubusercontent.com/shalb/monitoring-examples/main/cdev/monitoring-cluster-blog/project.yaml > project.yaml
curl https://raw.githubusercontent.com/shalb/monitoring-examples/main/cdev/monitoring-cluster-blog/monitoring.yaml > monitoring.yaml
Create S3 bucket to store the project’s state
Go to AWS S3 and create a new bucket. Replace the value of state_bucket_name key in config file project.yaml by the name of the created bucket.

Customize project’s settings
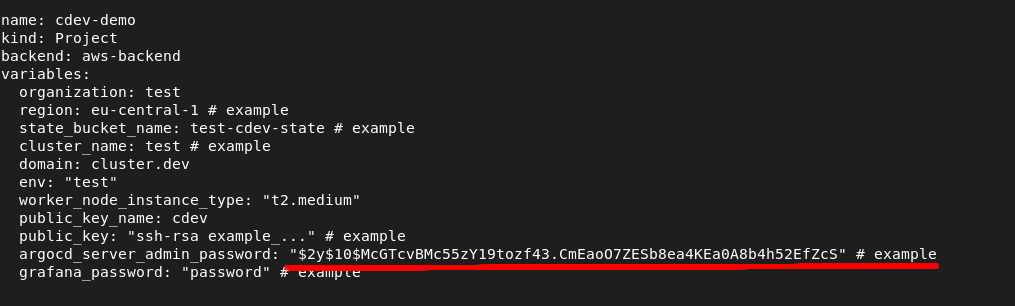
We shall set all the settings needed for our project in the project.yaml config file. We should customize all the variables that have # example comment in the end of line.
Select AWS Region
We should replace the value of region key in config file project.yaml by our region.
Set unique cluster name
By default we shall use cluster.dev domain as a root domain for cluster ingresses. We should replace the value of cluster_name key by a unique string in config file project.yaml, because the default ingress will use it in resulting DNS name.

This command may help us generate a random name and check whether it is in use:
CLUSTER_NAME=$(echo "$(tr -dc a-z0-9 </dev/urandom | head -c 5)")
dig argocd.${CLUSTER_NAME}.cluster.dev | grep -q "^${CLUSTER_NAME}" || echo "OK to use cluster_name: ${CLUSTER_NAME}"
If the cluster name is available we should see the message OK to use cluster_name: ...
Set SSH key
We should have access to cluster nodes via SSH. To add the existing SSH key we should replace the value of public_key key in config file project.yaml. If we have no SSH key, then we should create it.

Set ArgoCD password
In our project we shall use Argo CD to deploy our applications to the cluster. To secure Argo CD we should replace the value of argocd_server_admin_password key by a unique password in config file project.yaml. The default value is a bcrypted password string.
To encrypt our custom password we may use an online tool or encrypt the password by command:
alias cdev_bash='docker run -it -v $(pwd):/workspace/cluster-dev --env-file=env --network=host --entrypoint="" clusterdev/cluster.dev:v0.6.3 bash'
cdev_bash
password=$(tr -dc a-zA-Z0-9,._! </dev/urandom | head -c 20)
apt install -y apache2-utils && htpasswd -bnBC 10 "" ${password} | tr -d ':\n' ; echo ''
echo "Password: $password"
exit
Set Grafana password
Now we are going to add a custom password for Grafana. To secure Grafana we should replace the value of grafana_password key by a unique password in config file project.yaml.

This command may help us generate a random password:
echo "$(tr -dc a-zA-Z0-9,._! </dev/urandom | head -c 20)"
Run bash in Cluster.dev container
To avoid installation of all needed tools directly to the client host, we will run all commands inside the Cluster.dev container. In order to execute Bash inside the Cluster.dev container and proceed to deploy, run the command:
cdev_bash
Deploy the project
Now we should deploy our project to AWS via cdev command:
cdev apply -l debug | tee apply.log
In case of successful deployment we should get further instructions on how to access Kubernetes, and the URLs of Argo CD and Grafana web UIs. Sometimes, because of DNS update delays we need to wait some time to access those web UIs. In such case we can forward all needed services via kubectl to the client host:
kubectl port-forward svc/argocd-server -n argocd 18080:443  > /dev/null 2>&1 &
kubectl port-forward svc/monitoring-grafana -n monitoring 28080:80  > /dev/null 2>&1 &
We may test our forwards via curl:
curl 127.0.0.1:18080
curl 127.0.0.1:28080
If we see no errors from curl, then the client host should access these endpoints via any browser.
Destroy the project
We can delete our cluster with the command:
cdev apply -l debug
cdev destroy -l debug | tee destroy.log
Conclusion
Within this article we have learnt how to deploy the Prometheus monitoring stack with the Cluster.dev AWS-K3s template. The resulting stack allows us to monitor workloads in our cluster. We can also reuse the stack as a prepared infrastructure pattern to launch environments for testing monitoring cases, before applying them to production.